Logging V Monitoring: Part 1
Introduction
What do you do when your application is down? Better yet: How can you predict when your application may go down? How do you begin an investigation in the most efficient way possible and resolve issues quickly?
Understanding the difference between logging and monitoring is critical, and can make all the difference in your ability to trace issues back to their root cause. If you confuse the two or use one without the other, you’re setting yourself up for long nights and weekends debugging your app.
In this article, we’ll look at how to effectively log and monitor your systems. I’ll tell you about a few good practices that I’ve learned over the years and some interesting metrics that you may want to monitor in your systems. Finally, I’ll show you a small web application that had no monitoring, alerting, or logging. I’ll demonstrate how I fixed the logging and how I’ve implemented monitoring and alerting around those logs.
Everyone has some sort of logging in their applications, even if it’s just writing to a file to review later. By the end of this article, I hope to convince you that logging without monitoring is about as good as no logging at all. Along the way, we can review some best practices for becoming a better logger.
Logging vs Monitoring
For a while, I conflated logging and monitoring. At least, I thought they were two sides of the same coin. I hadn’t considered how uniquely necessary they each were, and how they supported each other.
Logging tells you what happened, and gives you the raw data to track down the issue.
Monitoring tells you how your application is behaving and can alert you when there are issues.
Can’t Have One Without the Other
Let’s consider a system that has fantastic logging but no monitoring. It’s obvious why this doesn’t work. No matter how good our logs are, I guarantee that nobody actively reads them — especially when our logs get verbose or use formatting like JSON. It is impractical to assume that someone will comb all those logs and look for errors. Maybe when we have a small set of beta users, we can expect them to report every error so we can go back and look at what happened. But what if we have a million users? We can’t expect every one of those users to report each error they encounter.

This is where monitoring comes in. We need to put the systems in place that can do the looking up and coordinating for us. We need a system that will let us know when an error happens and, if it is good enough, why that error occurred.
Monitoring
Let’s begin by talking about monitoring goals and what makes a great monitoring system. First, our system must be able to notify us when it detects errors. Second, we should be able to create alerts based on the needs of our system.
We want to lay out the specific types of events that will determine if our system is performing correctly or not. You may want to be alerted about every error that gets logged. Alternatively, you may be more interested in how fast your system responds in cases. Or, you might be focused on whether your error rates are normal or increasing. You may also be interested in security monitoring and what solution suits your cases. For some additional examples of things to monitor, I’d suggest you check out a great article written by Heroku here.
One final thing to consider is how our monitoring system can point us toward solutions. This will vary greatly depending on your application; still, it is something to consider when picking your tools.
Speaking of tools, here are some of my favorite tools to use when I’m monitoring an application. I’m sure there are more specific ones out there. If you’ve got some tools that you really love, then feel free to leave them in the comments!
Elasticsearch: This is where I store my logs. It lets me set up monitors and alerts in Grafana based on log messages. With Elasticsearch, I can also do full-text searches when I’m trying to find an error’s cause.
Kibana: This lets me easily perform live queries against Elasticsearch to assist in debugging.
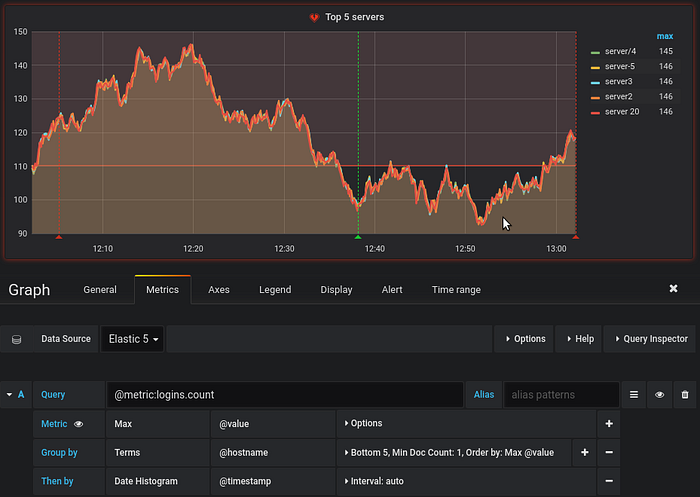
Grafana: Here, I create dashboards that provide high-level overviews of my applications. I also use Grafana for its alerting system.

InfluxDB: This time-series database records things like response times, response codes, and any interesting point-in-time data (like success vs error messages within a batch).
Pushover: When working as a single engineer in a project, Pushover gives me a simple and cheap notification interface. It directly pushes a notification to my phone whenever an alert is triggered. Grafana also has native support for Pushover, so I only have to put in a few API keys and I am ready to go.
PagerDuty: If you are working on a larger project or with a team, then I would suggest PagerDuty. With it, you can schedule specific times when different people (like individuals on your team) receive notifications. You can also create escalation policies in case someone can’t respond quickly enough. Again, Grafana offers native support for PagerDuty.
Heroku: There are other monitoring best practices in this article from Heroku. If you are within the Heroku ecosystem, then you can look at their logging add-ons (most of which include alerting).
Monitoring Example Project
Let’s look at an example project: a Kubernetes-powered web application behind an NGINX proxy, whose log output and response codes/times we want to monitor. If you aren’t interested in the implementation of these tools, feel free to skip to the next section.
Kubernetes automatically writes all logs to stderr and stdout to files on the file system. We can monitor these logs easily, so long as our application correctly writes logs to these streams. As an aside, it is also possible to send your log files directly to Elasticsearch from your application. But for our example project, we want the lowest barrier to entry.
Now that our application is writing logs to the correct locations, let’s set up Elasticsearch, Kibana, and Filebeat to collect the output from the container. Additional and more up-to-date information can be found on the Elastic Cloud Quickstart page.
First, we deploy the Elastic Cloud Operator and RBAC rules.
kubectl apply -f https://download.elastic.co/downloads/eck/1.3.1/all-in-one.yaml# Monitor the output from the operator
kubectl -n elastic-system logs -f statefulset.apps/elastic-operator
Next, let’s actually deploy the Elasticsearch cluster.
cat <<EOF | kubectl apply -f -
apiVersion: elasticsearch.k8s.elastic.co/v1
kind: Elasticsearch
metadata:
  name: quickstart
spec:
  version: 7.10.2
  nodeSets:
  - name: default
    count: 1
    config:
      node.store.allow_mmap: false
EOF# Wait for the cluster to go green
kubectl get elasticsearch
Now that we have an Elasticsearch cluster, let’s deploy Kibana so we can visually query Elasticsearch.
cat <<EOF | kubectl apply -f -
apiVersion: kibana.k8s.elastic.co/v1
kind: Kibana
metadata:
  name: quickstart
spec:
  version: 7.10.2
  count: 1
  elasticsearchRef:
    name: quickstart
EOF# Get information about the kibana deployment
kubectl get kibana
Review this page for more information about accessing Kibana.
Finally, we’ll add FileBeat, using this guide, to monitor the Kubernetes logs and ship them to Elasticsearch.
cat <<EOF | kubectl apply -f -
apiVersion: beat.k8s.elastic.co/v1beta1
kind: Beat
metadata:
  name: quickstart
spec:
  type: filebeat
  version: 7.10.2
  elasticsearchRef:
    name: quickstart
  config:
    filebeat.inputs:
    - type: container
      paths:
      - /var/log/containers/*.log
  daemonSet:
    podTemplate:
      spec:
        dnsPolicy: ClusterFirstWithHostNet
        hostNetwork: true
        securityContext:
          runAsUser: 0
        containers:
        - name: filebeat
          volumeMounts:
          - name: varlogcontainers
            mountPath: /var/log/containers
          - name: varlogpods
            mountPath: /var/log/pods
          - name: varlibdockercontainers
            mountPath: /var/lib/docker/containers
        volumes:
        - name: varlogcontainers
          hostPath:
            path: /var/log/containers
        - name: varlogpods
          hostPath:
            path: /var/log/pods
        - name: varlibdockercontainers
          hostPath:
            path: /var/lib/docker/containers
EOF# Wait for the beat to go green
kubectl get beat
Since our application uses NGINX as a proxy, we can use this wonderful module to write the response codes and times to InfluxDB.
Next, you can follow this guide to get Grafana running in your Kubernetes cluster. After that, set up the two data sources we are using: InfluxDB and Elasticsearch.
Finally, set up whatever alert channel notifiers you wish to use. In my case, I’d use Pushover since I’m just one developer. You may be more interested in something like PagerDuty if you need a fully-featured notification channel.
And there you have it! We’ve got an application — one we can set up dashboards and alerts for using Grafana.
This setup can notify us about all sorts of issues. For example:
- We detected any ERROR level logs.
- We are receiving too many error response codes from our system.
- We are noticing our application responding slower than usual.
We did all this without making many changes to our application; and yet, we now have a lot of tools available to us. We can now instrument our code to record interesting points in time using InfluxDB. For example, if we received a batch of 500 messages and 39 of them were unable to be parsed, we can post a message to InfluxDB telling us that we received 461 valid messages and 39 invalid messages. We can then set up an alert in Grafana to let us know if that ratio of valid to invalid messages spikes.
Essentially, anything that is interesting to code should be interesting to monitor; now, we have the tools necessary to monitor anything interesting in our application.
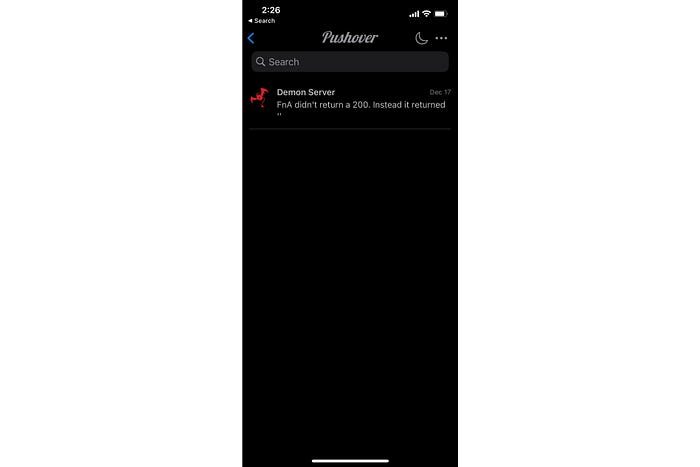
As a small bonus, here is a Pushover alert that I received from a setup similar to the one described above. I accidentally took down my father’s website during an experiment and this was the result.

At this point, I’ll give you a break to digest everything I’ve talked about. In part two I’ll be discussing some logging best practices.